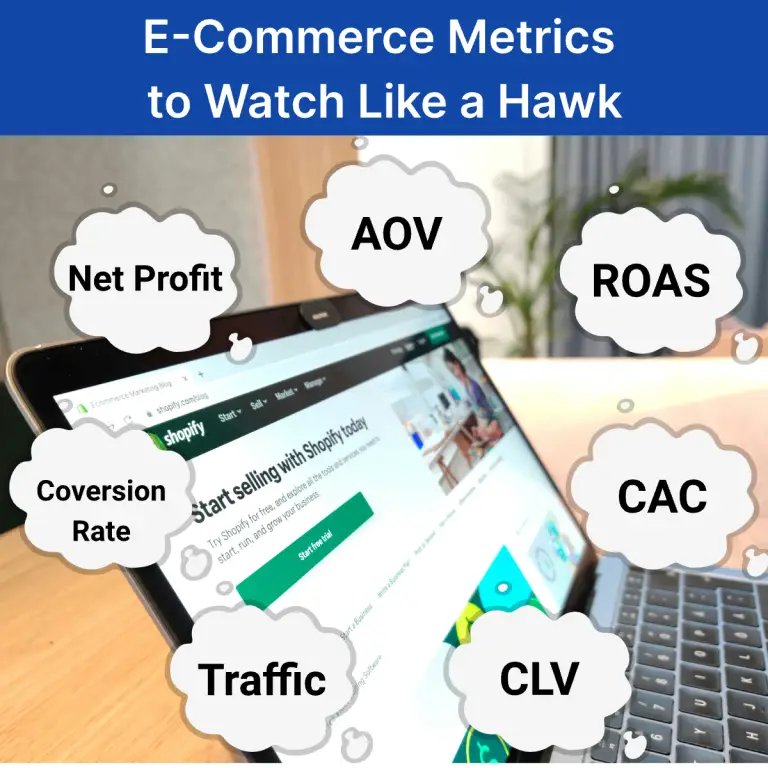
Good morning, e-commerce executives. Welcome to the latest edition of The Bulletin. Today, we’re diving into the key metrics that every e-commerce business should watch like a hawk. E-Commerce is often called a “numbers game” and there is some real truth to that. Keeping a close eye on these metrics will be the difference between flying high and crashing and burning.
But don’t take our word for it. As always, we’ve interviewed a handful of brands from a variety of industries to give their perspective on these metrics.
Too Much Data? Focus on What Counts

Ever felt overwhelmed by the sheer volume of data and metrics that your brand produces?
In a world overflowing with data, it’s crucial to zero in on the metrics that truly drive decisions. Focusing on key performance indicators like those mentioned in this article ensures you’re making smart, impactful decisions. Forget the fluff—track what matters.
As Sarib Rehman of the school-supply shop Flipcost puts it, “I review key metrics monthly to focus on numbers linked to revenue, not vanity metrics…Measure, test, optimize.”
Note: Want your brand to be featured in “The Bulletin”? Just send us a note!
Conversion Rate: Your Sales Superstar
Let’s start with the big one: conversion rate. This metric tells you the percentage of visitors who actually make a purchase. It’s a direct indicator of how well your site turns interest into sales. A low conversion rate means it’s time to tweak your product pages, CTAs, or overall user experience.
The Secret Sauce: A/B Testing
A/B testing is your secret weapon for boosting conversion rates. By pitting two versions of a webpage or element against each other, you can see which one your audience loves more. Whether it’s tweaking headlines, images, or CTAs, this method helps you make data-driven decisions to optimize your site. The best part? Even small changes can lead to big wins, turning more visitors into happy customers.
Case in point?
Daryl Tavernor from Terraces Menswear consistently weights conversion rates across multiple dimensions (like traffic source, product page, and marketing campaign). In his own words, “Our newest A/B test on our product pages increased sales 15% by highlighting customer reviews and adding a limited-time discount.”
Customer Acquisition Cost (CAC): Spending Smart
CAC measures how much you’re spending to acquire each new customer. Knowing this helps you gauge the effectiveness of your marketing efforts. Lowering your CAC while maintaining or increasing sales volume means you’re getting more bang for your buck. Keep an eye on this to ensure you’re spending smartly.
Return on Ad Spend (ROAS): Measuring Marketing Success

Relatedly, ROAS tells you how much revenue you’re earning for every dollar spent on advertising. It’s a vital metric for assessing the effectiveness of your ad campaigns. A high ROAS means your ads are hitting the mark, while a low ROAS signals a need for strategy adjustments.
Average Order Value (AOV): Maximizing Each Basket
Your AOV tells you the average amount spent each time a customer completes a purchase. Boosting your AOV can significantly impact your revenue without needing to increase traffic. Think upsells, cross-sells, and enticing product bundles.
Putting Together AOV, ROAS, and Conversion Rate
Mature brands amplify their use of data by considering one metric in light of another. For example, some brands have a solid understanding of what conversion rate is required in order to yield a healthy ROAS, which is informed in turn by knowing what AOV will yield a profit.
Looking for benchmarking?
Dieter Hsiao, owner of the digital growth agency DIVISA, has a solid understanding of the levers that impact the bottom line for his clients. As he puts it, “For example, if conversion rate drops below 2.5%, I redesign the checkout flow or landing page experience. I aim for over $75 AOV and 2:1 ROAS to scale efficiently.”
But keep in mind that the specific targets will vary for each and every brand.
Customer Lifetime Value (CLV): The Long Game
CLV estimates the total revenue you can expect from a customer over their entire relationship with your business. Understanding CLV helps you justify your CAC and focus on retaining customers, not just acquiring new ones. It’s about playing the long game.
Tools like Boardroom’s CRM can provide a window into CLV across a variety of dimensions.
Cart Abandonment Rate: Closing the Deal

This metric shows the percentage of shoppers who add items to their cart but don’t complete the purchase. A high abandonment rate can signal issues like high shipping costs, complicated checkout processes, or simply a need for better follow-up emails and reminders.
Ira Lysa, the owner of a luxury fashion brand, was able to cut down their cart abandonment rate by 10% by introducing an automated email sequence with personalized discounts.
Traffic Sources: Knowing Your Audience

Understanding where your traffic comes from is crucial. Are your visitors finding you through organic search, social media, or paid ads? Knowing this helps you focus your marketing efforts on the most effective channels.
For Lysa, Instagram yields the highest quality visitors. “We invested more money in Instagram ads based on this insight and increased our sales by 30 percent within two months.”
Profit is King
Net profit is the bottom line—literally. It’s the ultimate measure of your business’s health, showing what you actually take home after all expenses. Sure, revenue is flashy, but net profit is what keeps the lights on and fuels growth. Keep an eye on it to ensure your hard work translates into real, sustainable success.
The Easiest Way to Track Net Profit (…and All Your Metrics)
Monitoring these metrics might sound overwhelming, but we can help. Our founder developed Boardroom to solve this problem after chaotically running 6 e-commerce brands. So, our dashboard aggregates all your data sources and auto-calculates these critical metrics in one place, giving you a comprehensive view of your business’ health. With real-time updates and easy-to-read visuals, you’ll never miss a beat.
Speaking of, we’re going to take a beat. Until next time…thanks for reading The Bulletin!


